| Main |
About EIG |
Services | Methodology | Equipment | Aerial Photography | Reports | Contact Us | Site Map |
|
The
findings of a historical/industrial/environmental airphoto analysis
can take many forms. At the lowest level of complexity is, perhaps, a
simple phone call with the specific answer to a prior question from
the client. Some cases may have many of these, followed up usually by
a written version of the information. If the project involved
fieldwork by the Photo Interpreter(s), some ground photos, or oblique
aerial photos might be forwarded to the
client right away.
|
||||||||
| In order to present the results more formally, a site map, or annotated aerial photo, or perspective sketch of the facility will normally be needed. Given here at the right is a simple perspective sketch of an industrial site under investigation. As much as possible, annotation numbers and names will match those already in use for the site. An oblique (or a vertical) photo can also be used to allow the reader to follow the site features discussed in the report. | |
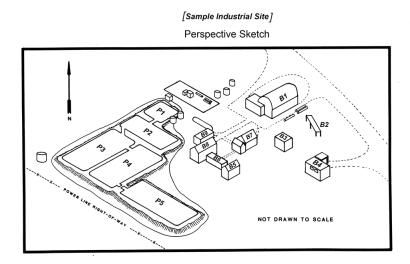 “Perspective Sketch” of an industrial site under historical airphoto analysis. |
||||||
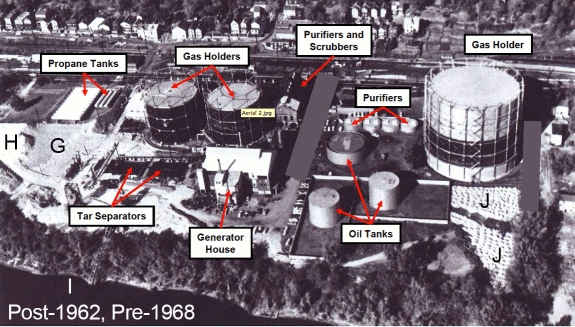 Annotated, historical, oblique airphoto, labeled and roughly dated from vertical airphotos of known date. |
||||||||
| A
more advanced form of the oblique sketch map might be a video
simulation, which could be viewed as a still image like the one below
or viewed as a site fly-through. This could also be one of many,
played chronologically to show the growth of a site as seen on the
historical aerial photos. |
||||||||
 “Video
Simulation” of a site oblique view (prepared by consultant Brian
Harston). these can be viewed as still photos or a fly-through video.
|
||||||||
| Another common tool for illustrating the results of a study is the feature-tracking chart or table. This can be a very simple, binary chart (right), indicating that the feature either existed, or did not exist for each year of historical aerial photography. It might also take the form of a spreadsheet (below) in which each cell contains some description of the feature, at the time of each historical aerial photo. |
Simplest
design “Feature Tracking Chart” for industrial components. Years of
photography are the rows; site features are the columns.
| |
||||||
 “Feature Tracking Table” for waste pits. |
||||||||
|
For sites which justify the effort, it is also possible to
create a Site Chronology which lists brief summaries of both the
ground information (from company records, EPA reports, witness
interviews, lab results, etc.), and the aerial photo information. The
key design feature of this particular tool, is that the ages of the
information are displayed by the corresponding position in the table.
That is, the summary of a ground report is positioned beside the
aerial photo information from, as much as possible, the same time
period. |
||||||||

Exhaustive
“Site Chronology”: the two left-hand columns represent
information from ground reports, historical site visits, lab results, etc.;
the two right-hand columns contain the information, for the corresponding time, from historical aerials. The full chart is 43 pages long. |
||||||||
|
Mini-Reports
are also quite common. These may illustrate the answer to a narrow,
specific question, or they may be the analysis results of everything
discernible on the airphotos for a certain feature.
|
||||||||
 |
Rapid
“Mini Report” on a single site feature, in response to a client request
during a broader study. A Mini Report (for existing information)
will typically be issued within 48 hours of the request by the client
|
|||||||
The full version of this is the “Site Report”. In the most typical case, this will contain description of all of the visible evidence of activities and site features from one year of historical aerial coverage. |
||||||||
|
Textual
part of a detailed “Site Report”; this represents the airphoto analysis
findings from a single year of historical coverage, among many.
|
 |
|||||||
| These are typically forwarded to
the client one at a time, to make the information available to the
project team as soon as possible. Finally, after all available aerial
photography has been examined and reported on, the individual Site
Reports may be combined into a single, chronological summary by
combining the various report files and editing. Further features can be
added to this, such as: an executive summary, a table of contents, a
listing of all annotated features in the individual reports, etc. Various other products can also be created after the analysis work has been done. For example, a detailed spreadsheet can be assembled, giving an overview of all features annotated in the reports. In this context, “annotated” means labeled on the illustrations and referred to in the report itself. The annotation numbers allow the reader to quickly identify which feature is being described in the report. |
||||||||
 Detailed spreadsheet of “Annotated Features” in the Photo Interpretation Report. The 47-page table is part of the Appendix of a larger airphoto history report. This can also be printed as a long, continuous roll (going down) for display in a discussion. |
||||||||
| Another summary product of the
work could be a “Site History Overview” containing cropped airphotos of
the site, taken from each of the years of aerial photography obtained.
Depending on how the files are managed and compressed, this could be
printed very large (e.g., as a poster) or zoomed on extensively to
compare the various states of the facility through time. |
||||||||
 Historical airphoto overview of all coverages for the site. Produced as a large poster, this is very useful during meetings and presentations. |
||||||||
| Most
of these various formats for the results of a study have come from
requests by the clients for a certain illustration tool to be used for a
specific purpose. Many other formats are certainly out there to be
discovered or developed. For example, a time-lapse video of perfectly
matched aerials could be created to visually present the entire visual
history of an industrial facility from start to finish, in two or three
minutes! This could be used in a briefing, and repeatedly stopped and
restarted as necessary for the discussion. The purpose for all of these various formats for reporting results, is to more clearly make the narrow, detailed, even “tedious” findings of the Photo Interpreter(s) understandable to others. In addition, they can demonstrate the thoroughness of the effort to study and express many physical aspects of the true history of an industrial site. Of course, aerial photography can only tell you part of the story of what’s going on on the ground at some time in the past. However, if the work is done carefully and conservatively, then the aerial photo information will be very difficult to undermine or dispute. Thus, producing reliable information with integrity is the goal of this work. |
||||||||